Real-Time Global Monitoring
This project is a core microservice within a larger humanitarian architecture, focusing on the ingestion, validation, and visualization of global crisis alerts. It implements a robust infrastructure capable of handling sensitive data with precision and scalability.
Backend & Cloud-Native Architecture
- High-Performance API: Backend developed with Hono and
TypeScript, focused on speed and strict data typing. - Flexible Persistence:
MongoDBAtlas database for a flexible data schema, ideal for the varied nature of different disaster types (earthquakes, famine, etc.). - Intelligent Processing: AI integration for image recognition (filtering inappropriate content) and Natural Language Processing (NLP) to classify the sentiment of anonymous citizen reports.
Frontend & UX Focused on Critical Data
- Modern Angular: SPA built with the latest
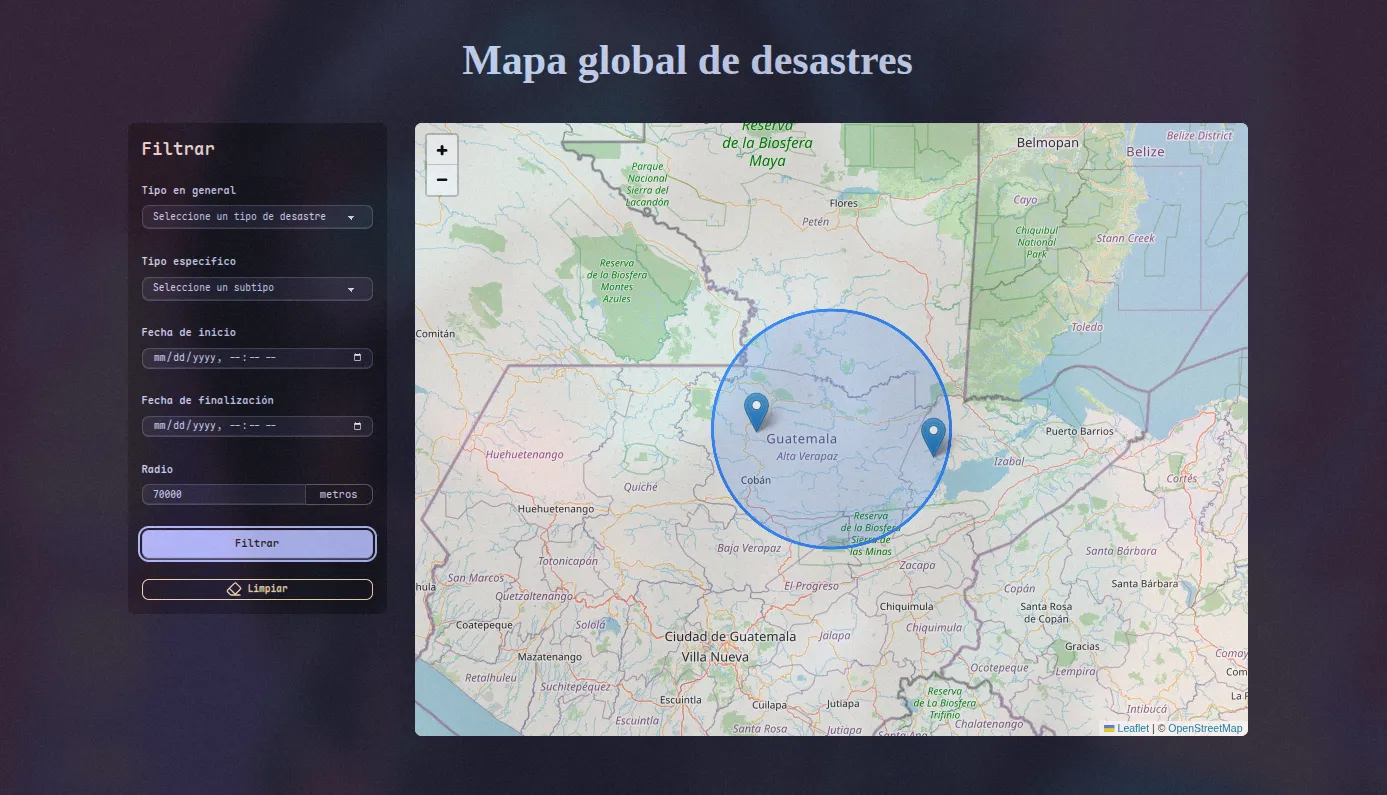
Angular 20features (Standalone APIs and Signals), ensuring a fluid and reactive user experience. - Geospatial Visualization: Implementation of an interactive map that uses GeoJSON data to display the exact location of events, allowing advanced filtering by type, date, and geographic location.
- Adaptive Design: Interface styled with Tailwind CSS and DaisyUI, featuring dynamic components that change the alert detail display based on the catastrophe type (e.g., earthquake magnitude vs. famine victims).
DevOps & Automated Deployment
- Orchestration with Kubernetes: Deployment of the entire solution on Google Cloud Platform (GCP) using Kubernetes to manage the high availability of deployments and services.
- Configuration Management: Use of Kubernetes Secrets and ConfigMaps to handle sensitive credentials and environment variables securely and decoupled from the source code.
- Serverless Integration: Automated notifications implemented using serverless functions (Lambda/Azure Functions) triggered by alert update events.
Demo Screenshots
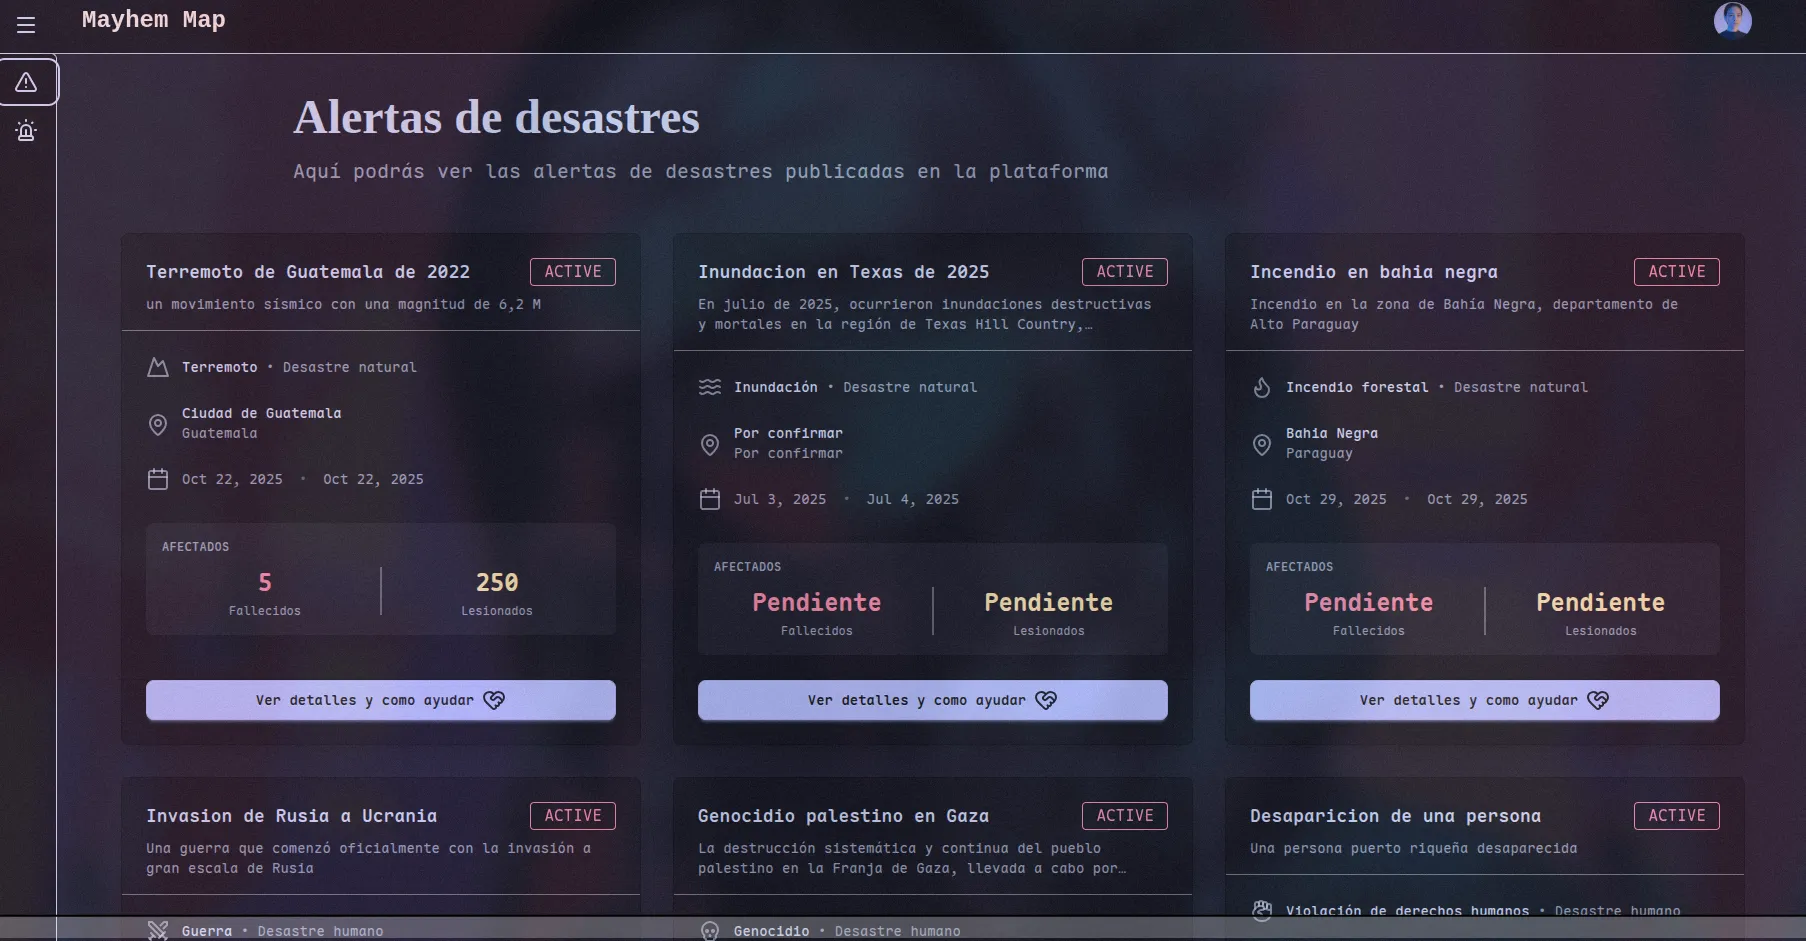 Dashboard view with a list of active alerts, prioritized by impact.
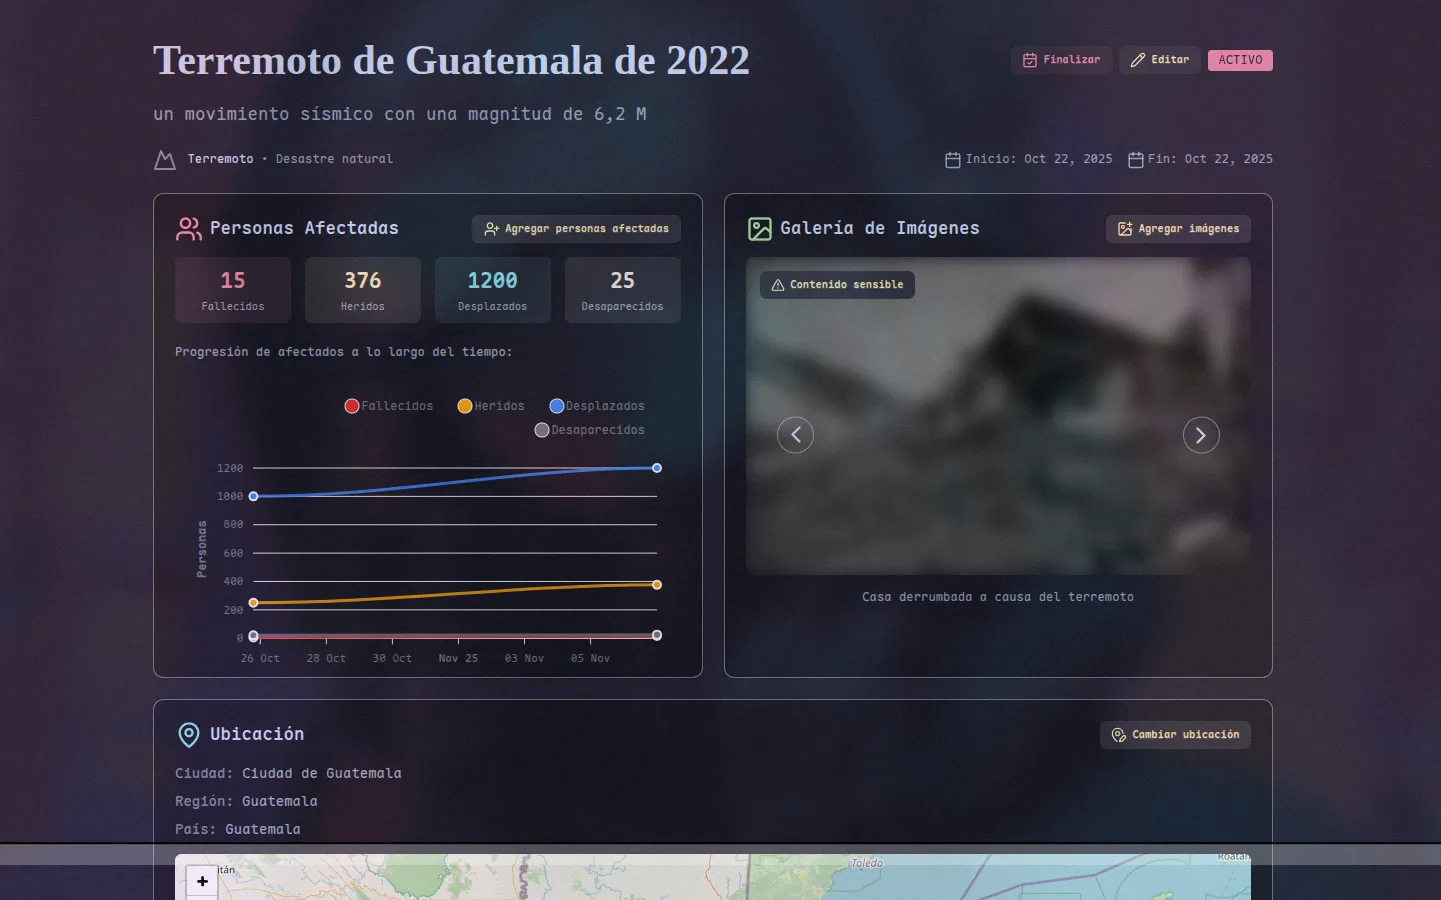 Details screen for a natural disaster (earthquake), displaying specific metrics like magnitude and depth.
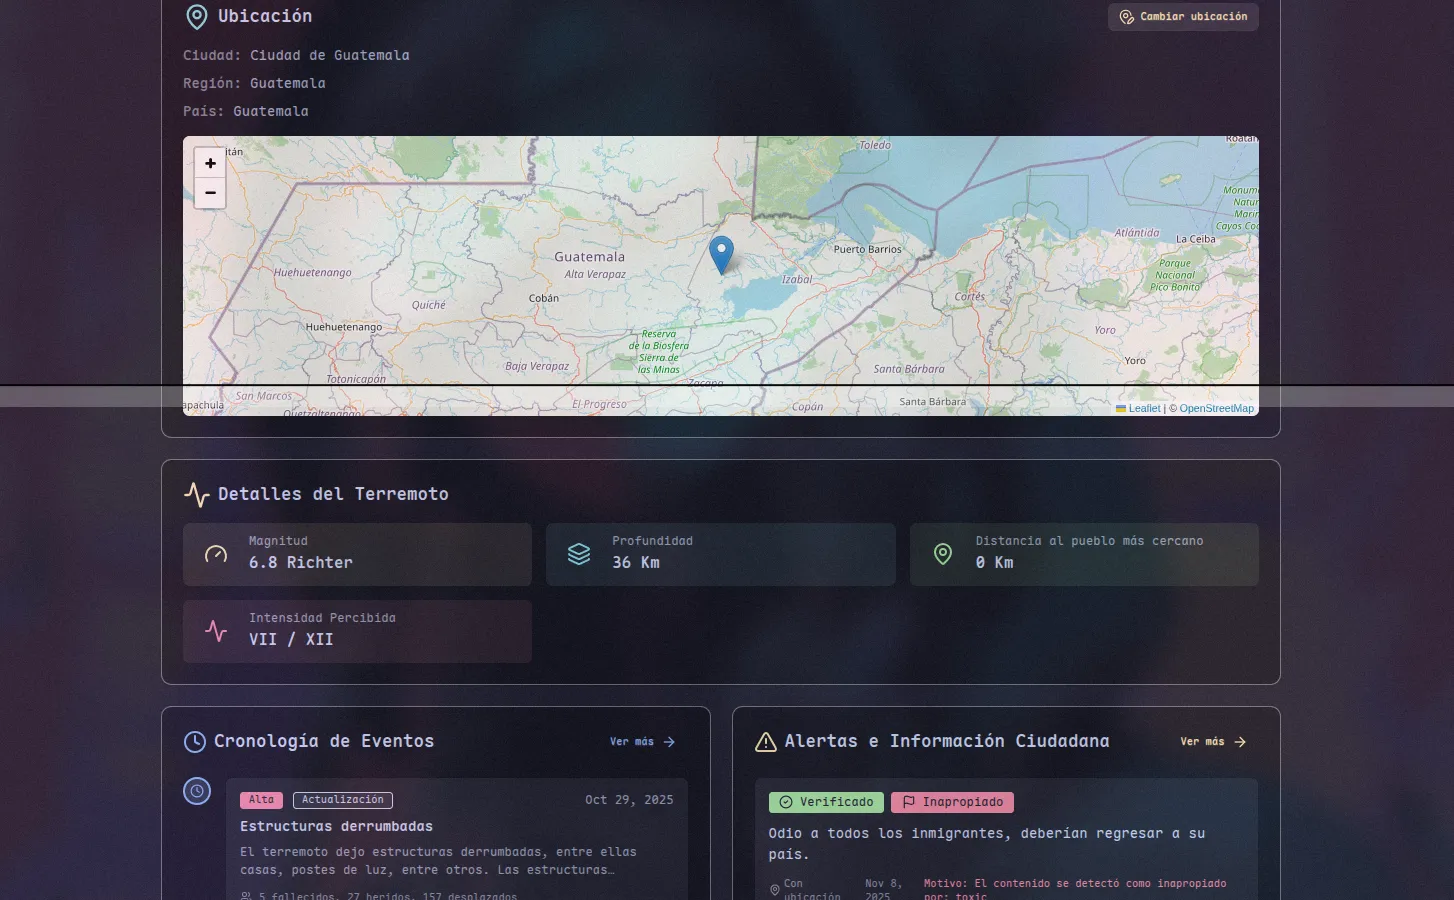 Interactive map and technical details of the epicenter location and impact on nearby towns.
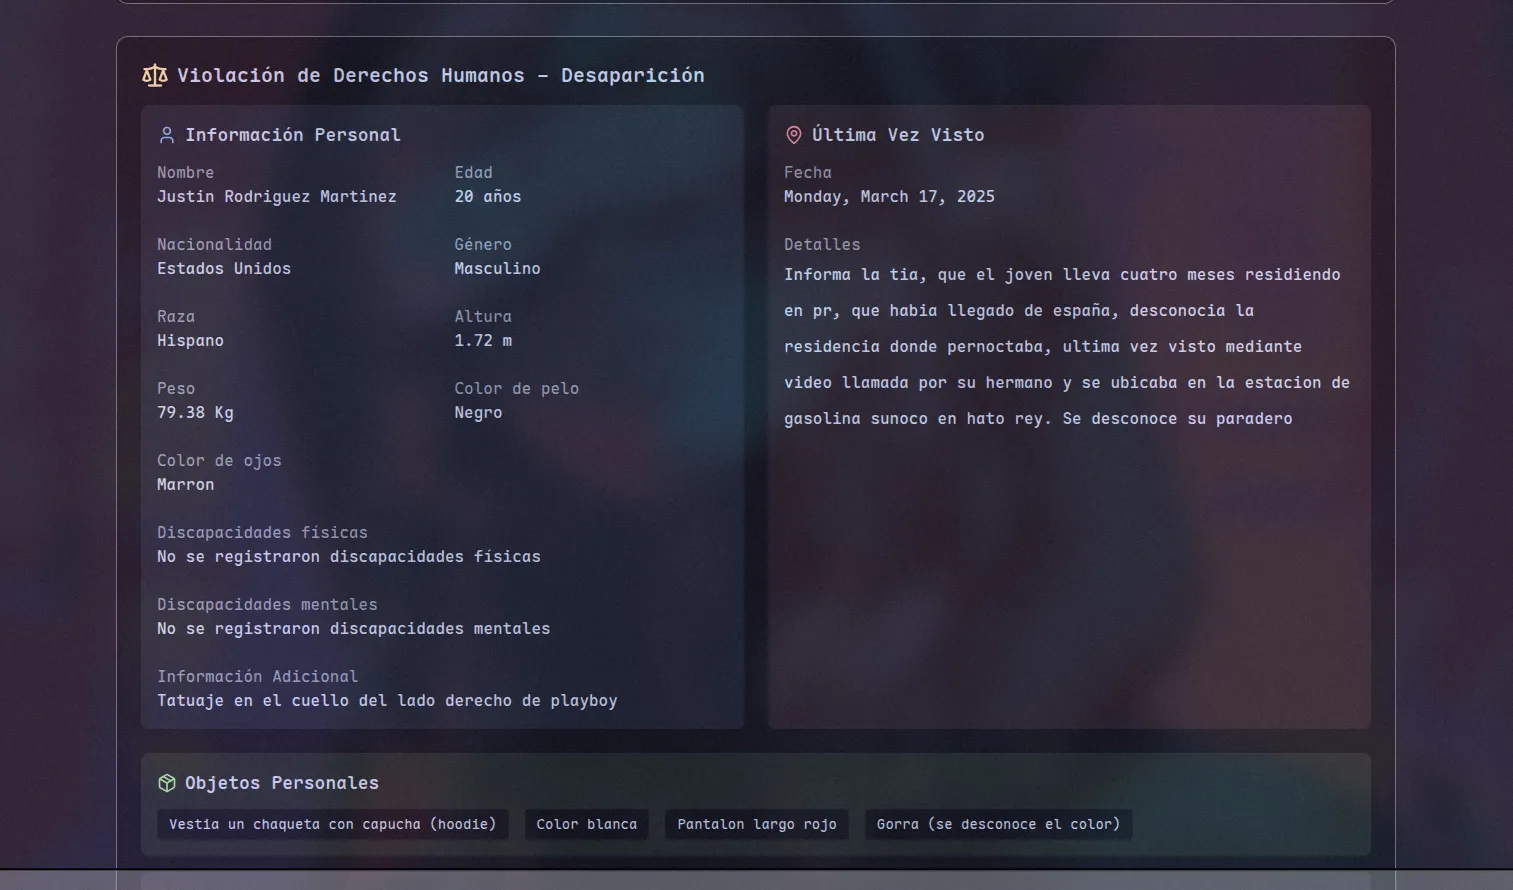 Example of a dynamic interface: details of a humanitarian alert (missing person) which vary significantly from a natural disaster.
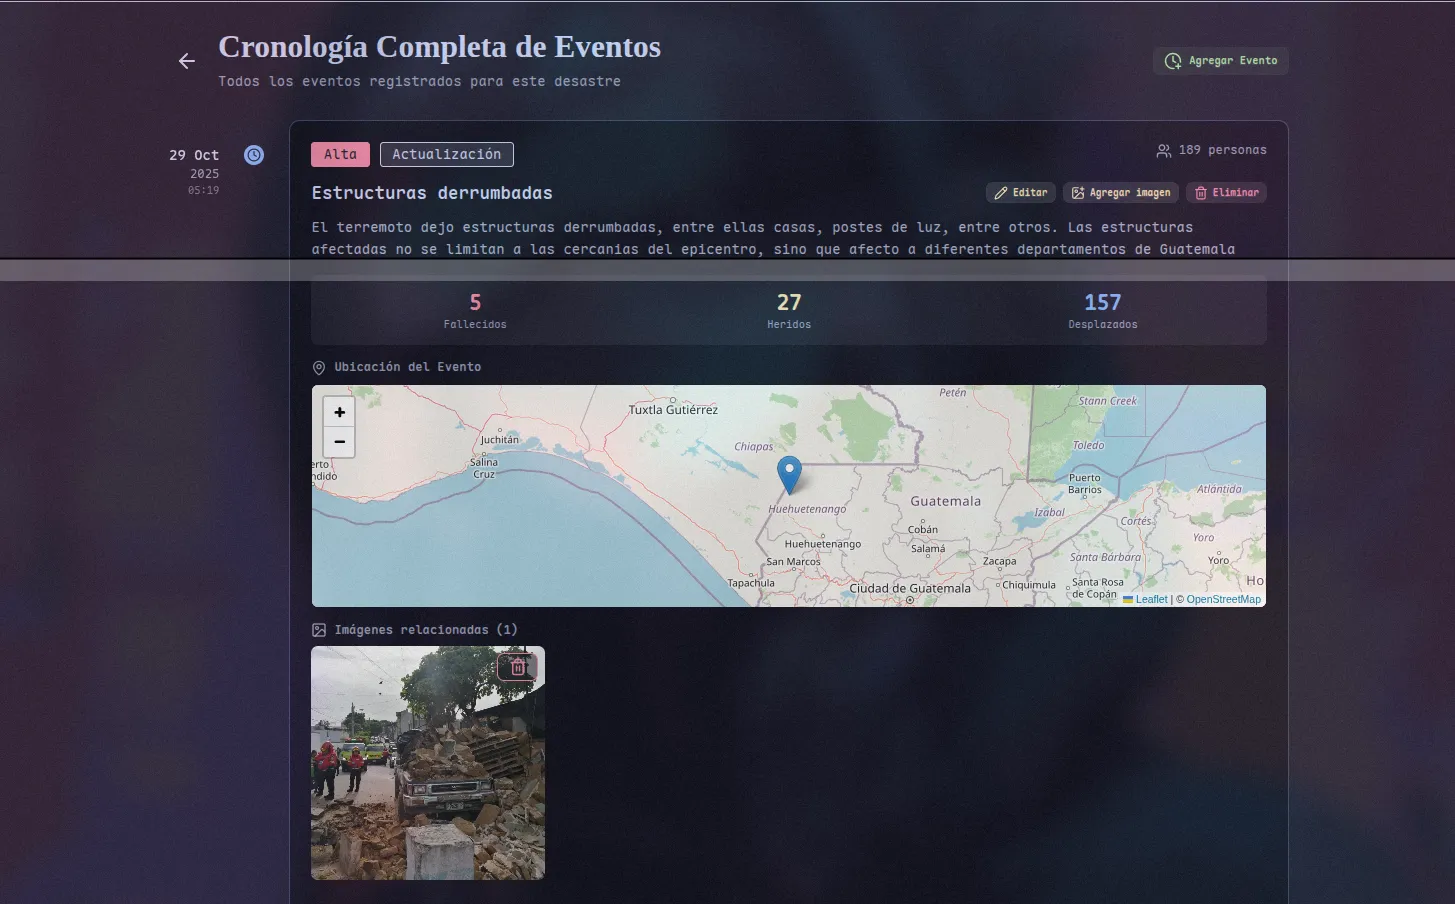 Detailed timeline showing the tracking and evolution of the disaster with timestamps and key locations.